- West Contra Costa Unified School District
- California Schools Dashboard
-
New 2017-18 Local Indicator Self-Reflection Tool: English | Spanish
California Schools Dashboard
The California Department of Education's (CDE) new Accountability and Continuous Improvement System is part of the Local Control Funding Formula (LCFF), which revamps school district funding. The California Schools Dashboard reports district and school performance on LCFF State Priority Areas using a combination of state and local priorities (see chart on bottom right). View WCCUSD district results, learn about the dashboard in the WCCUSD Cal Schools Dashboard Guide and District Report, or select your school to view results.
California School Dashboard
The California School Dashboard is a key component of California’s new accountability system. Districts submit data to the California Department of Education (CDE) through the CALPADS system.

This page is an excerpt from the WCCUSD Cal Schools Dashboard Guide and District Report. View the whole guide in a printer-friendly version here. Local Indicators
2017-18 WCCUSD Local Indicator Self-Reflection Tool
English | Spanish Dashboard Results
Results from the Dashboard are analyzed in the Local Control Accountability Plan (LCAP) and used to determine district and school areas of progress and need. This new accountability system replaces the Academic Performance Index (API) and Adequate Yearly Progress (AYP).
ACSA Video Guide to Cal Schools Dashboard
What do the Performance Level Colors Mean? 
 WCCUSD on Cal Schools Dashboard
The Dashboard includes four reports at the school and district level: equity, status and change, detailed, and student groups (including low income, students with disabilities, English learners, homeless and foster youth). Indicators are also reported by ethnicity.
State Indicators- Suspension Rate
- Graduation Rate
- English Learner Progress
- Academics: English language arts/literacy (ELA) and Mathematics (Grades 3-8)
- College & Career (available in Fall 2017)
Chronic Absenteeism (available in Fall 2018)
- Basics: Teachers, Instructional Materials, Facilities
- Academic Standards Implementation: Classroom Observational Rubric
- Parent Engagement : California School Parent Survey (CSPS)
- Local Climate Survey: California Healthy Kids Survey (CHKS)
The five color-coded circles symbolize the performance levels for the District, schools, and student groups. Blue is the highest level, while red is the lowest. Each circle has a different number of triangles that corresponds to a specific color. For example, the red performance level has one triangle and the blue performance level has five triangles.  How are Performance Levels calculated?
Performance levels are calculated based on the district or school’s status and change in performance level over time.

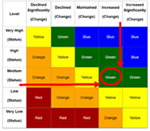
 The CDE uses the five-by-five color table to the right to calculate performance levels using status and change.
For example, suppose a district increased from a low status last year to a medium status this year. The current level would be found by combining the current status (medium) and the change (increased). In the example to the right, we see that the district received a green performance level.
The CDE has developed separate five-by-five tables for each state indicator.Learn more about the Cal Schools dashboard and view WCCUSD results

